Professor Jennifer Visser-Rogers is VP of Statistical Research and Consultancy at PHASTAR and was recently named as one of Women in DataôÛãs Twenty in Data & Tech.
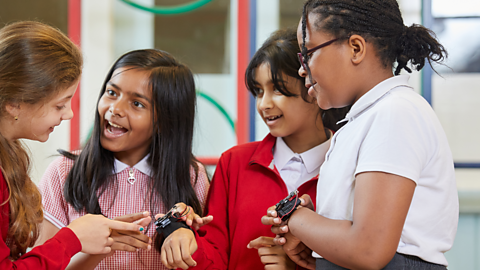
Outside her day job, the statistician is passionate about helping children to understand data and statistics so she jumped at the chance to get involved with our ôÕÑ¿èÓ micro:bit playground survey, a series of cross-curricular activities designed to help primary school children get to grips with data science and digital skills.
We caught up with Jennifer to hear more about her passion for numbers and to find out how schools and parents can inspire the next generation of statisticians.
How did you first become interested in a career in statistics?
I didnãt always have a great relationship with maths to be honest. I lacked confidence in the subject and was convinced that I was no good at it. I had chosen three of my four A-levels and my maths teacher convinced me to take it as my final subject. It was there that I did a statistics module and I absolutely fell in love with it. With statistics you could see data, you could visualise it and it had a real practical application. And once I started working in medical statistics, and I realised that numbers could be used to help keep people alive longer and with a better quality of life, thatãs when I really knew Iãd found what I wanted to do.
Did you feel encouraged to follow this path when you were at school?
I have my maths teacher Mrs Heptinstall to thank for my career! She saw something in me that I couldnãt see in myself at the time. I was really lucky because I was certainly not that engaged with maths as a subject in school. I, like so many others, thought to myself ãwhat is the point in this, when am I going to use it?ã. So it was great to have the support of teachers showing me that it was a viable career choice.
Tell us a bit about how you got to the current point in your career.
I worked in universities for a while as a lecturer and researcher, but then an opportunity came to set up and run a consultancy unit in the statistics department at the University of Oxford. I really enjoyed working with different companies, finding out what problems they were working on, and how I could use data and statistics to help solve them. I liked seeing the immediate impact of the work that I was doing and thought that I wanted to do more of it, so I made the move into industry and now help pharmaceutical companies run clinical trials so that they can understand if new treatments for all sorts of medical conditions work and are safe.
"I love that Iãve been able to use data and statistics to have an impact inãÎ lots of different areas"
Whatãs the best thing about working in this field?
John Tukey, a well-known statistician, once said that the best thing about being a statistician is that you get to play in everyoneãs backyards. You can use statistics to learn about new medical advances, climate change, the economy, retail, the list goes on! I love that Iãve been able to use data and statistics to have an impact in and learn a bit about lots of different areas.
Why do you think itãs important for children to understand data and statistics?
Data is everywhere these days. But data on its own doesnãt tell us anything. Data is the raw material of knowledge, and it takes statistics to make sense of it and turn it into a story. I always say that everyone is a secret statistician. We all collect data and use it to make decisions about how to live our day-to-day lives. We are now well and truly a data generation, and we are bombarded with statistics daily which we are then expected to use to make decisions about our own lives. Itãs so important that we are teaching children to be data literate so that they can not only interpret the statistics that they see, but also critically appraise them and ask the right questions of what they are presented with. Itãs important that we give children a toolbox of all the questions that they should be asking of the data and statistics that they see so that they can actually use this information appropriately, and also hold people to account when they think that something dodgy is going on.
"Letãs show children how maths and statistics are used in the real world, and why those skills are so important to learn"
What more can schools and parents do to encourage children in this field?
I think showing the importance of the application. The ãwhyã. Letãs show children how maths and statistics are used in the real world, and why those skills are so important to learn. My sister works in fashion and still texts me to help her out with maths problems! As we generate more and more data, itãs going to be impossible to escape, no matter what line of work children end up in, so itãs really important to make sure that they have positive experiences early on and can see the use.
Why do you think initiatives like the ôÕÑ¿èÓ micro:bit playground survey are important?
For those children who might eventually get into a career in coding, it gets them excited about those opportunities from a young age. This is especially important in making coding more accessible to girls and breaking down the barriers that it is a boyãs subject. I am a prime example of a girl who almost disengaged with maths completely, but really found my calling when I understood the applications. The micro:bit playground survey goes straight into thinking about applications; turning the micro:bit into a counter to monitor biodiversity, using it as a thermometer to record temperature. It is driven by real world applications of data and shows just how ubiquitous data is. Even for those children who wonãt go on to have careers in data and coding, it is teaching really important data literacy skills that absolutely everyone is going to need.
How do you think the playground survey can encourage children to become interested in data?
The playground survey will start to get children to understand that data is everywhere. In order to understand anything about the world, you will need to use data. Even if your favourite subject is geography, say, or PE, data is still important, and youãre still going to analyse some data at some point. Giving children positive experiences with data at a young age, showing its relevance whilst also making it fun, will hopefully change relationships with data so that in the future, people will feel empowered to use it, rather than intimidated by it.
The ôÕÑ¿èÓ micro:bit playground survey was created to help children aged 7 - 11 get to grips with data science and digital skills in a fun and practical way. Find out more about the seven activities and get free resources on the playground survey site.
This article was published in May 2024.

More from the ôÕÑ¿èÓ micro:bit playground survey
ôÕÑ¿èÓ micro:bit playground survey
Discover seven cross-curricular activities to find out more about your playground.

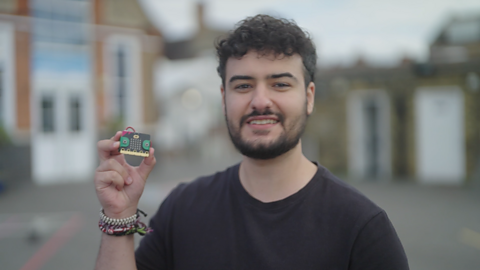
Yussef Rafik on how coding helps nature conservation
Wildlife TV Presenter Yussef Rafik talks about how the ôÕÑ¿èÓ micro:bit can play an important part in studying plants and animals.
ãThe digital world has endless possibilitiesã
Content creator Big Manny talks about inspiring a new generation of scientists and his passion for teaching.