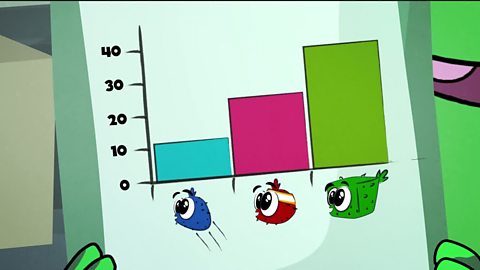
JEFF: Putter's under pressure, Janine. He needs to turn this around quick.
JANINE: He sure does, Jeff. Let's look at how the other player scored on this hole.
JEFF: Letãs start with the ãmeanã score.
JANINE: No need to get nasty, Jeff.
JEFF: No no, the ãmeanã is the average score. We take all the scores then divide it with the number of people. So the average is 25 shots.
JANINE: Thatãs a bit high.
JEFF: Ah yes, thatãs because Louis got a really high score.
JANINE: How about we check the ãmodeã instead.
JEFF: Good thinking, Janine. Letãs order them and then see which occurs most often.
Which is three.
JANINE: We can even find the ãmedian,' Jeff. Just look at our ordered scores and itãs the one right in the middle, which is six!
JEFF: And thereãs a huge range too, Janine. If we subtract the lowest score from the highest score, thatãs a massive 97 shot range.
JANINE: Oh, looks like Putter's time is up.
GOLFER: Ohhhhh!
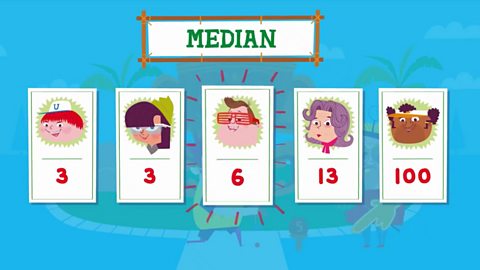
The median is the middle value.
- To find the median, order the numbers and see which one is in the middle of the list.
- Eg 3, 3, 6, 13, 100 = 6
- The median is 6.
If there are two middle values the median is halfway between them. This might not be a whole number.
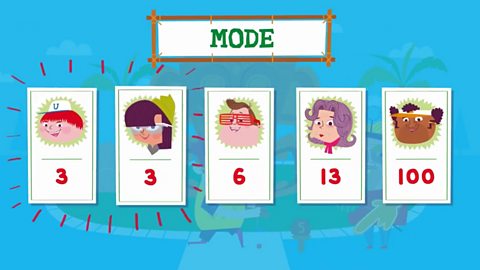
The mode is the number that appears the most.
- To find the mode, order the numbers lowest to highest and see which number appears the most often.
- Eg 3, 3, 6, 13, 100 = 3
- The mode is 3.
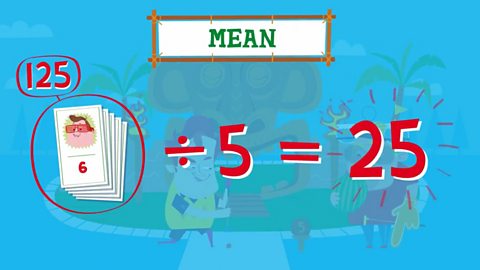
The mean is the total of the numbers divided by how many numbers there are.
- To find the mean, add all the numbers together then divide by the number of numbers.
- Eg 6 + 3 + 100 + 3 + 13 = 125 ûñ 5 = 25
- The mean is 25.
The mean is not always a whole number.

The range is the difference between the biggest and the smallest number.
- To find the range, subtract the lowest number from the biggest number.
- Eg 100 - 3 = 97
- The range is 97.
Play Bitesize games
Level up now! Take on the latest primary games on Bitesize.

More on Information and data
Find out more by working through a topic
- count4 of 6

- count5 of 6

- count6 of 6

- count1 of 6